
Area Deprivation Index and Vulnerable Populations — How do I find them?
If you're familiar with the unique health challenges faced by Vulnerable Populations, then you might be interested in the Area Deprivation Index, also called the ADI, which is available here on BroadStreet!
What is the Area Deprivation Index (ADI)?
The ADI is a validated, measure of social and economic status for neighborhoods. It has been studied for 20 years and has been associated with many important health outcomes.
Quick References:
- BroadStreet explains why we like the ADI: https://www.broadstreet.io/board/story/adi
- A really great research article explaining the methods from Intermountain Healthcare is available here: https://pubmed.ncbi.nlm.nih.gov/27683670/
About The ADI
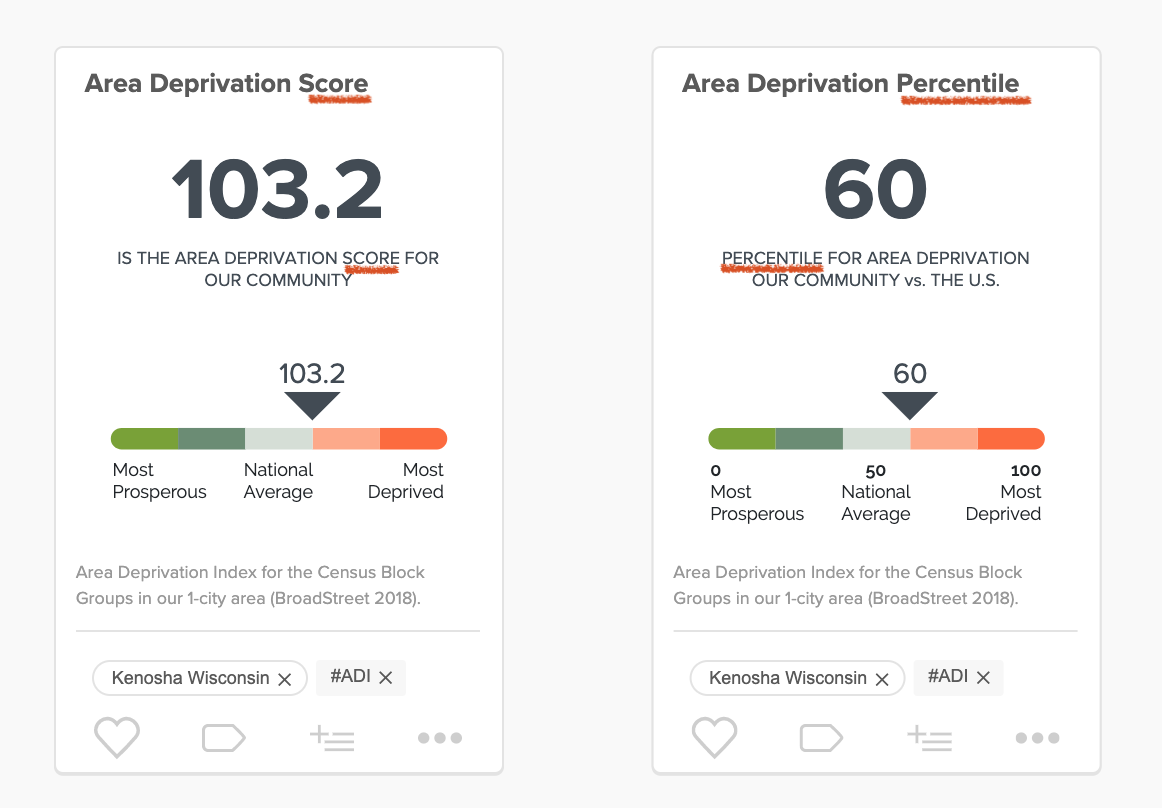
The Area Deprivation Index (ADI) is a standardized score with a score of 100 being the mean. Most (over 99%) communities will fall between a score of 40 to 160.
We also have an ADI percentile (on a card in the ADI report) that is 0 - 100% with 50% indicating a "middle of the nation" percentile.
Below is where to find it:
ADI in The Map Room
Run an ADI report
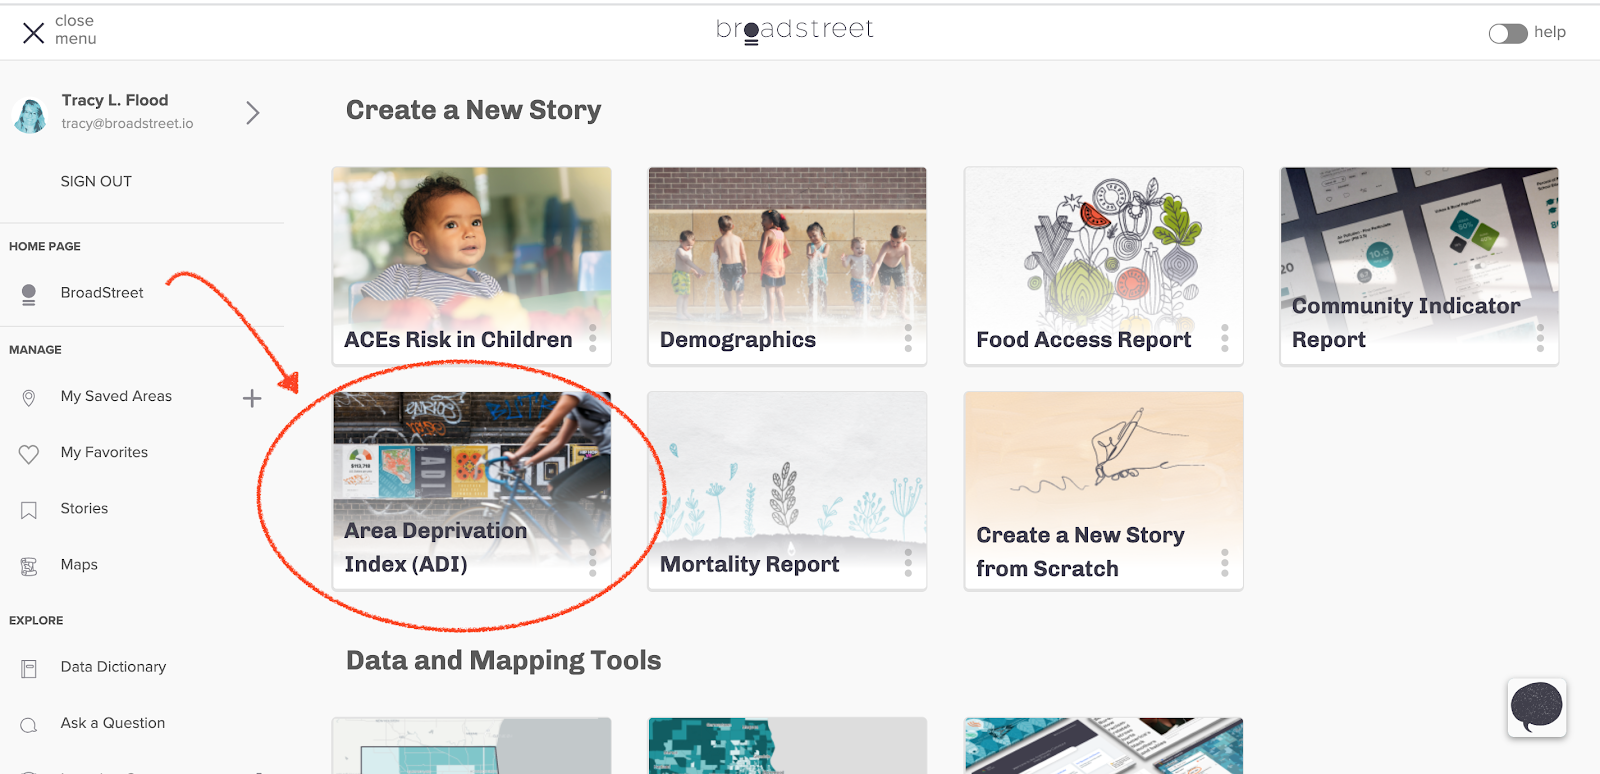
Run an Area Deprivation Index (ADI) Report or find ADI cards within the Community Indicator Report.
Hidden Features
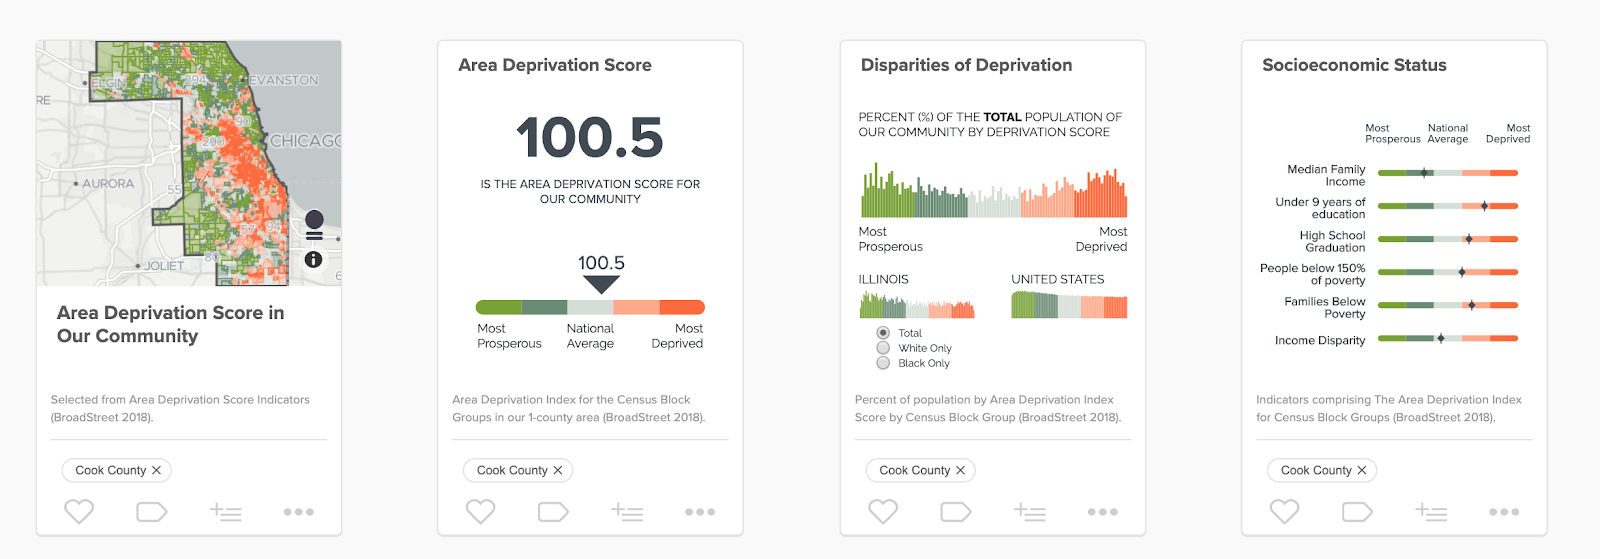
By clicking on the ADI map, you'll be taken to a more in-depth look at the Area Deprivation Index in a new window.
The first item you'll see in this new window is a larger version of the Area Deprivation Index map.
Below, you'll find the indicators that are factored into the Area Deprivation Index and you'll also be able to download this information for your own report by clicking on the left Download button.
For more information on how to download the data, please see the related article Can I download the data?
This article will help to answer questions such as:
- The potential range of area deprivation scores
- What is an average ADI score
- What indicators are within the ADI
- What is the area deprivation index?